Rethinking the Achievement Gap (Part 2)
CompetencyWorks Blog
This post originally appeared at Next Generation Learning Challenges on March 28, 2016 and the Workshop School on March 21, 2016. See Part 1 here.
I didn’t really know it at the time, but this graph would change the way I thought about the achievement gap.
Before opening the Workshop School, for two years we ran a small pilot project called the Sustainability Workshop. It was basically an alternative senior year program. We enrolled about 30 seniors a year from three neighborhood high schools, and ran them through an intensive one-year, project-based experience. To assess students’ learning at the end of the year, we administered the College and Work Readiness Assessment (CWRA).
CWRA is the only standardized test I’ve ever seen that I really like. Basically, students are given a real-world problem scenario and a library of documents, data sets, etc. Their challenge is to come up with and articulate solutions to the scenario. Their “performance task score” is a measure of their ability to think critically and solve problems. Since the tasks involve making sense of numbers and writing out answers, CWRA controls for what it calls “entering academic ability” – basically the type of literacy and math skills that the SAT requires.
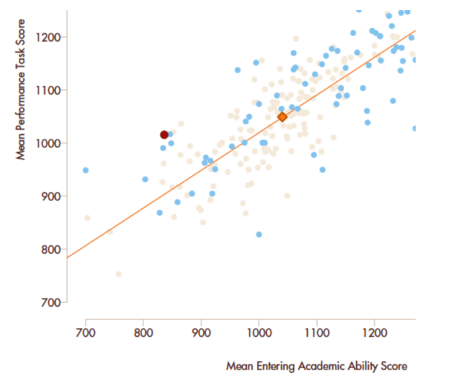
This graph above plots students’ critical thinking score (Y axis) against their entering academic ability score (X axis). Each data point represents a school or college. (CWRA is administered to both high school and first-year college students.) The line represents the regression, with the red diamond representing the average performance of first-year college students on the exam.
The red dot on the left hand side of the graph represents the performance of our students that year. Not surprisingly, when looking at entering academic ability, our students lagged far behind the typical first year college student. But when we look at critical thinking, their scores are nearly identical. Our students vastly outperformed what would be expected based on their entering academic ability (CWRA put them in the 99th percentile for this metric).
My point here isn’t that our students were awesome (though they were). It’s that our understanding of the achievement gap is a function of how we define achievement. If we define it in terms of traditional metrics, this graph tells the same old story: poor children of color lagging behind their more advantaged peers. But if we look at it in terms of critical thinking, the gap nearly disappears.
As someone who deeply believes that critical thinking, collaboration, self-awareness, ownership, and project management are just as important to students’ long-term success as literacy and numeracy (and maybe more so), I find this incredibly encouraging. Viewed through the lens of traditional tests, the achievement gap can seem insurmountable – a reflection of so many class advantages that it’s hard to see how it could ever be closed. Is it possible that because schools have not traditionally emphasized skills like critical thinking or collaboration, the “gap” between poor and middle class students is actually smaller?
Class is always going to be a factor in students’ prospects for success, and literacy and numeracy are both important. But if we rethink what achievement means, focusing on the skills that matter most, we may find that the “gap” that we’re so concerned about looks very different.
See also:
- NGLC Schools Take On Competency-Based Learning
- How Next Gen Learning Can Support Student Agency, Part 1
- Using Technology-Enhanced Items Effectively to Close Student Achievement Gaps
Matthew Riggan is a co-founder of the Workshop School, a project-based high school within the School District of Philadelphia.